Retention
Retention Analysis is a tool that lets you understand how many users continue to use the app and website. Repro’s Retention Analysis not only shows retention rates, but also allows you to investigate correlation between important events and retention.
Note
Activate event tracking to take advantage of Retention Analysis. See also Event Tracking.
|
Case Study: Twitter
By understanding user behavior with Retention Analysis, Twitter increased their new users’ rate of return by recommending them to follow 6 users or more during the sign up process.
|

Retention Analysis
Click [ANALYTICS] > [RETENTION] to display the Retention Analysis screen.

Filter settings

items |
Description |
|---|---|
PLATFORM |
You can choose from iOS/Android/Web. |
Filters |
You can filter by gender, email address, and other user profile criteria. |
Term |
Set the time period to be analyzed. In the case of Custom, the time period can be selected up to 25 months in advance.
|
Day/Week/Month |
Divide the period into days, weeks, months, and designations.
|
Event Settings
Retention can be checked based on the number of times an event occurs.
Below is an example that displays the analysis results for all users who accessed the product detail page at least once in the last 7 days.

CSV
Analysis data can be downloaded in CSV format.
Display the data you wish to output and click the CSV Download button.
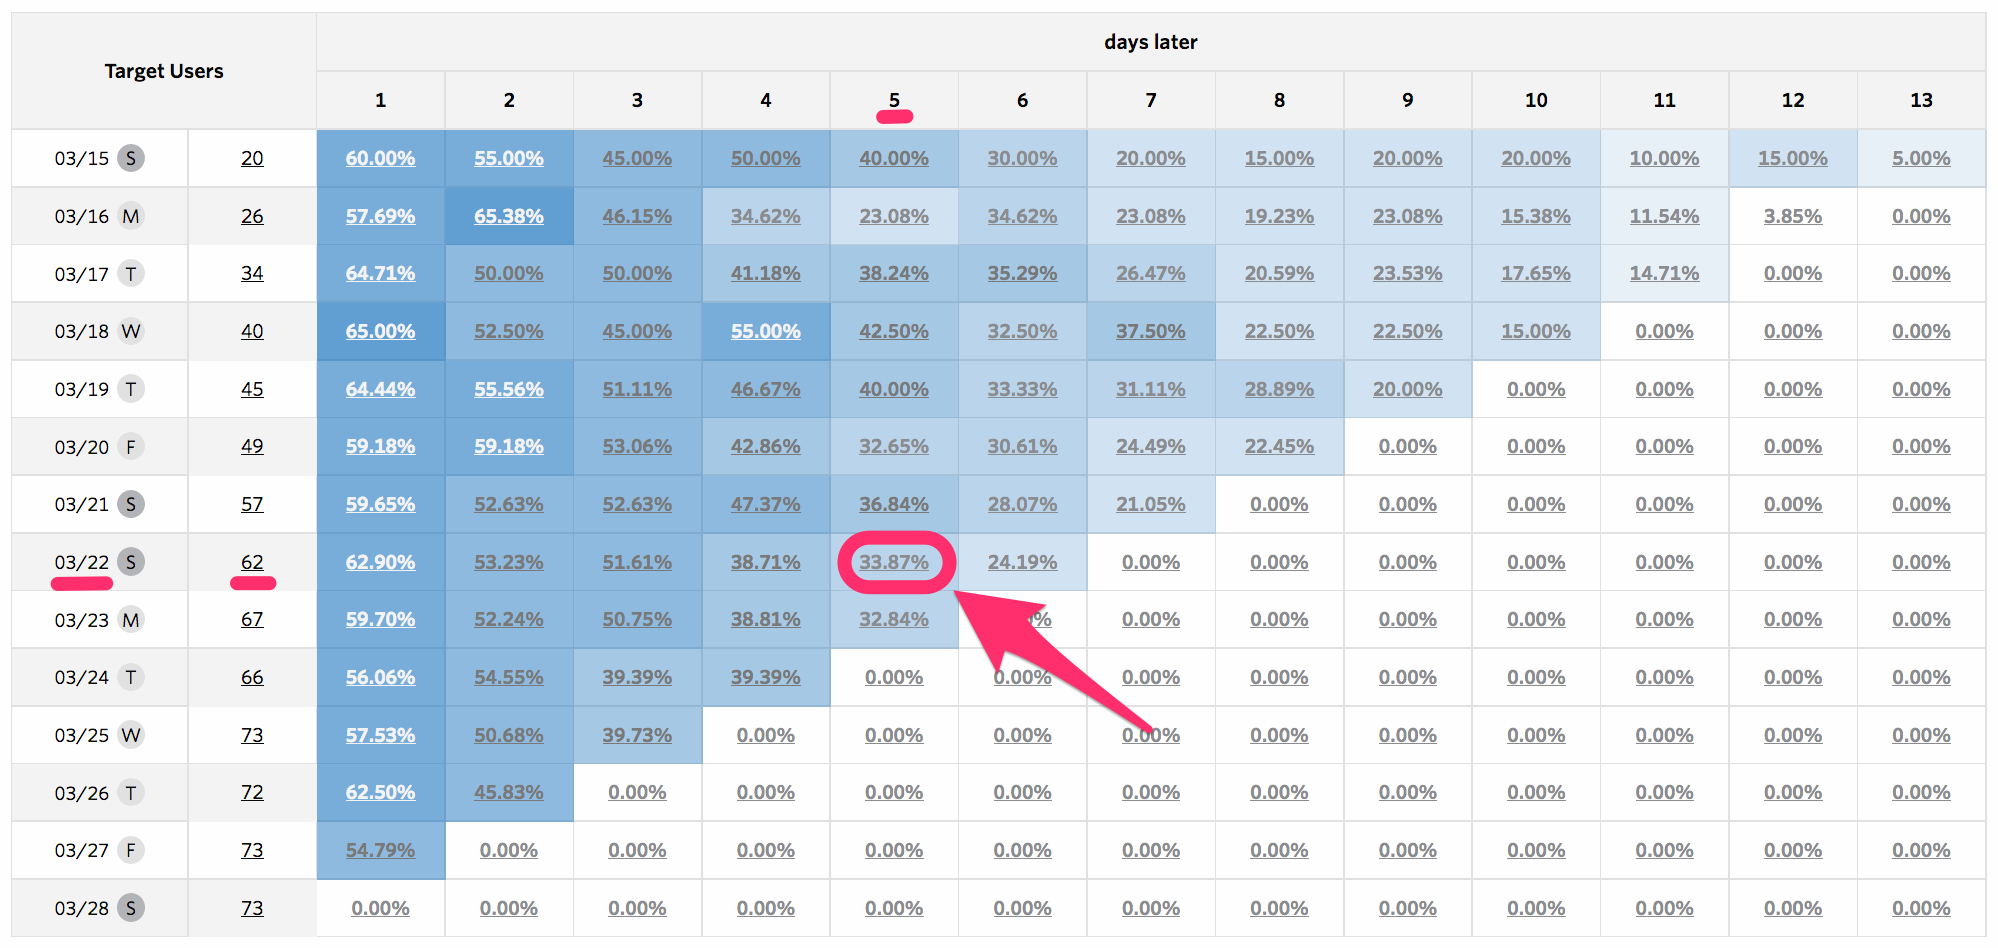
Chart
Y Axis shows the number of users per day according to the analytics settings.
X Axis shows the number of days it took for the users, shown in Y Axis, to come back to the app.
With the below example, the chart shows that there were 62 users who executed App Launch on March 22th, and 33.87% of them came back to the app after 5 days.
Example
In the case of an e-commerce service, you can set your retention analysis to show users coming back after they perform the “Product detail” event once (which is an event occurring when users visit the product detail page).
If you compare the above result with users who perform the same event twice or thrice, you can find out the optimum amount of times a user has to see a product detail page to have an increased rate to return to your app.